With years of experience in the automotive sector, we’ve developed a sharp understanding of how cars are bought and sold. In this guide, we take a closer look at the UK and global car markets, exploring the latest trends and standout statistics, and what they mean for both new and used vehicle sales.
Key Car Sales Statistics and Global Overview
China is the largest car market in the world, with over 31 million new vehicles sold in 2024. The USA had the second-highest figure for new cars sold, followed by India and Japan.
- The UK's new vehicle market is the seventh-largest in the world.
- In 2024, 1.953 million new cars were sold in the UK.
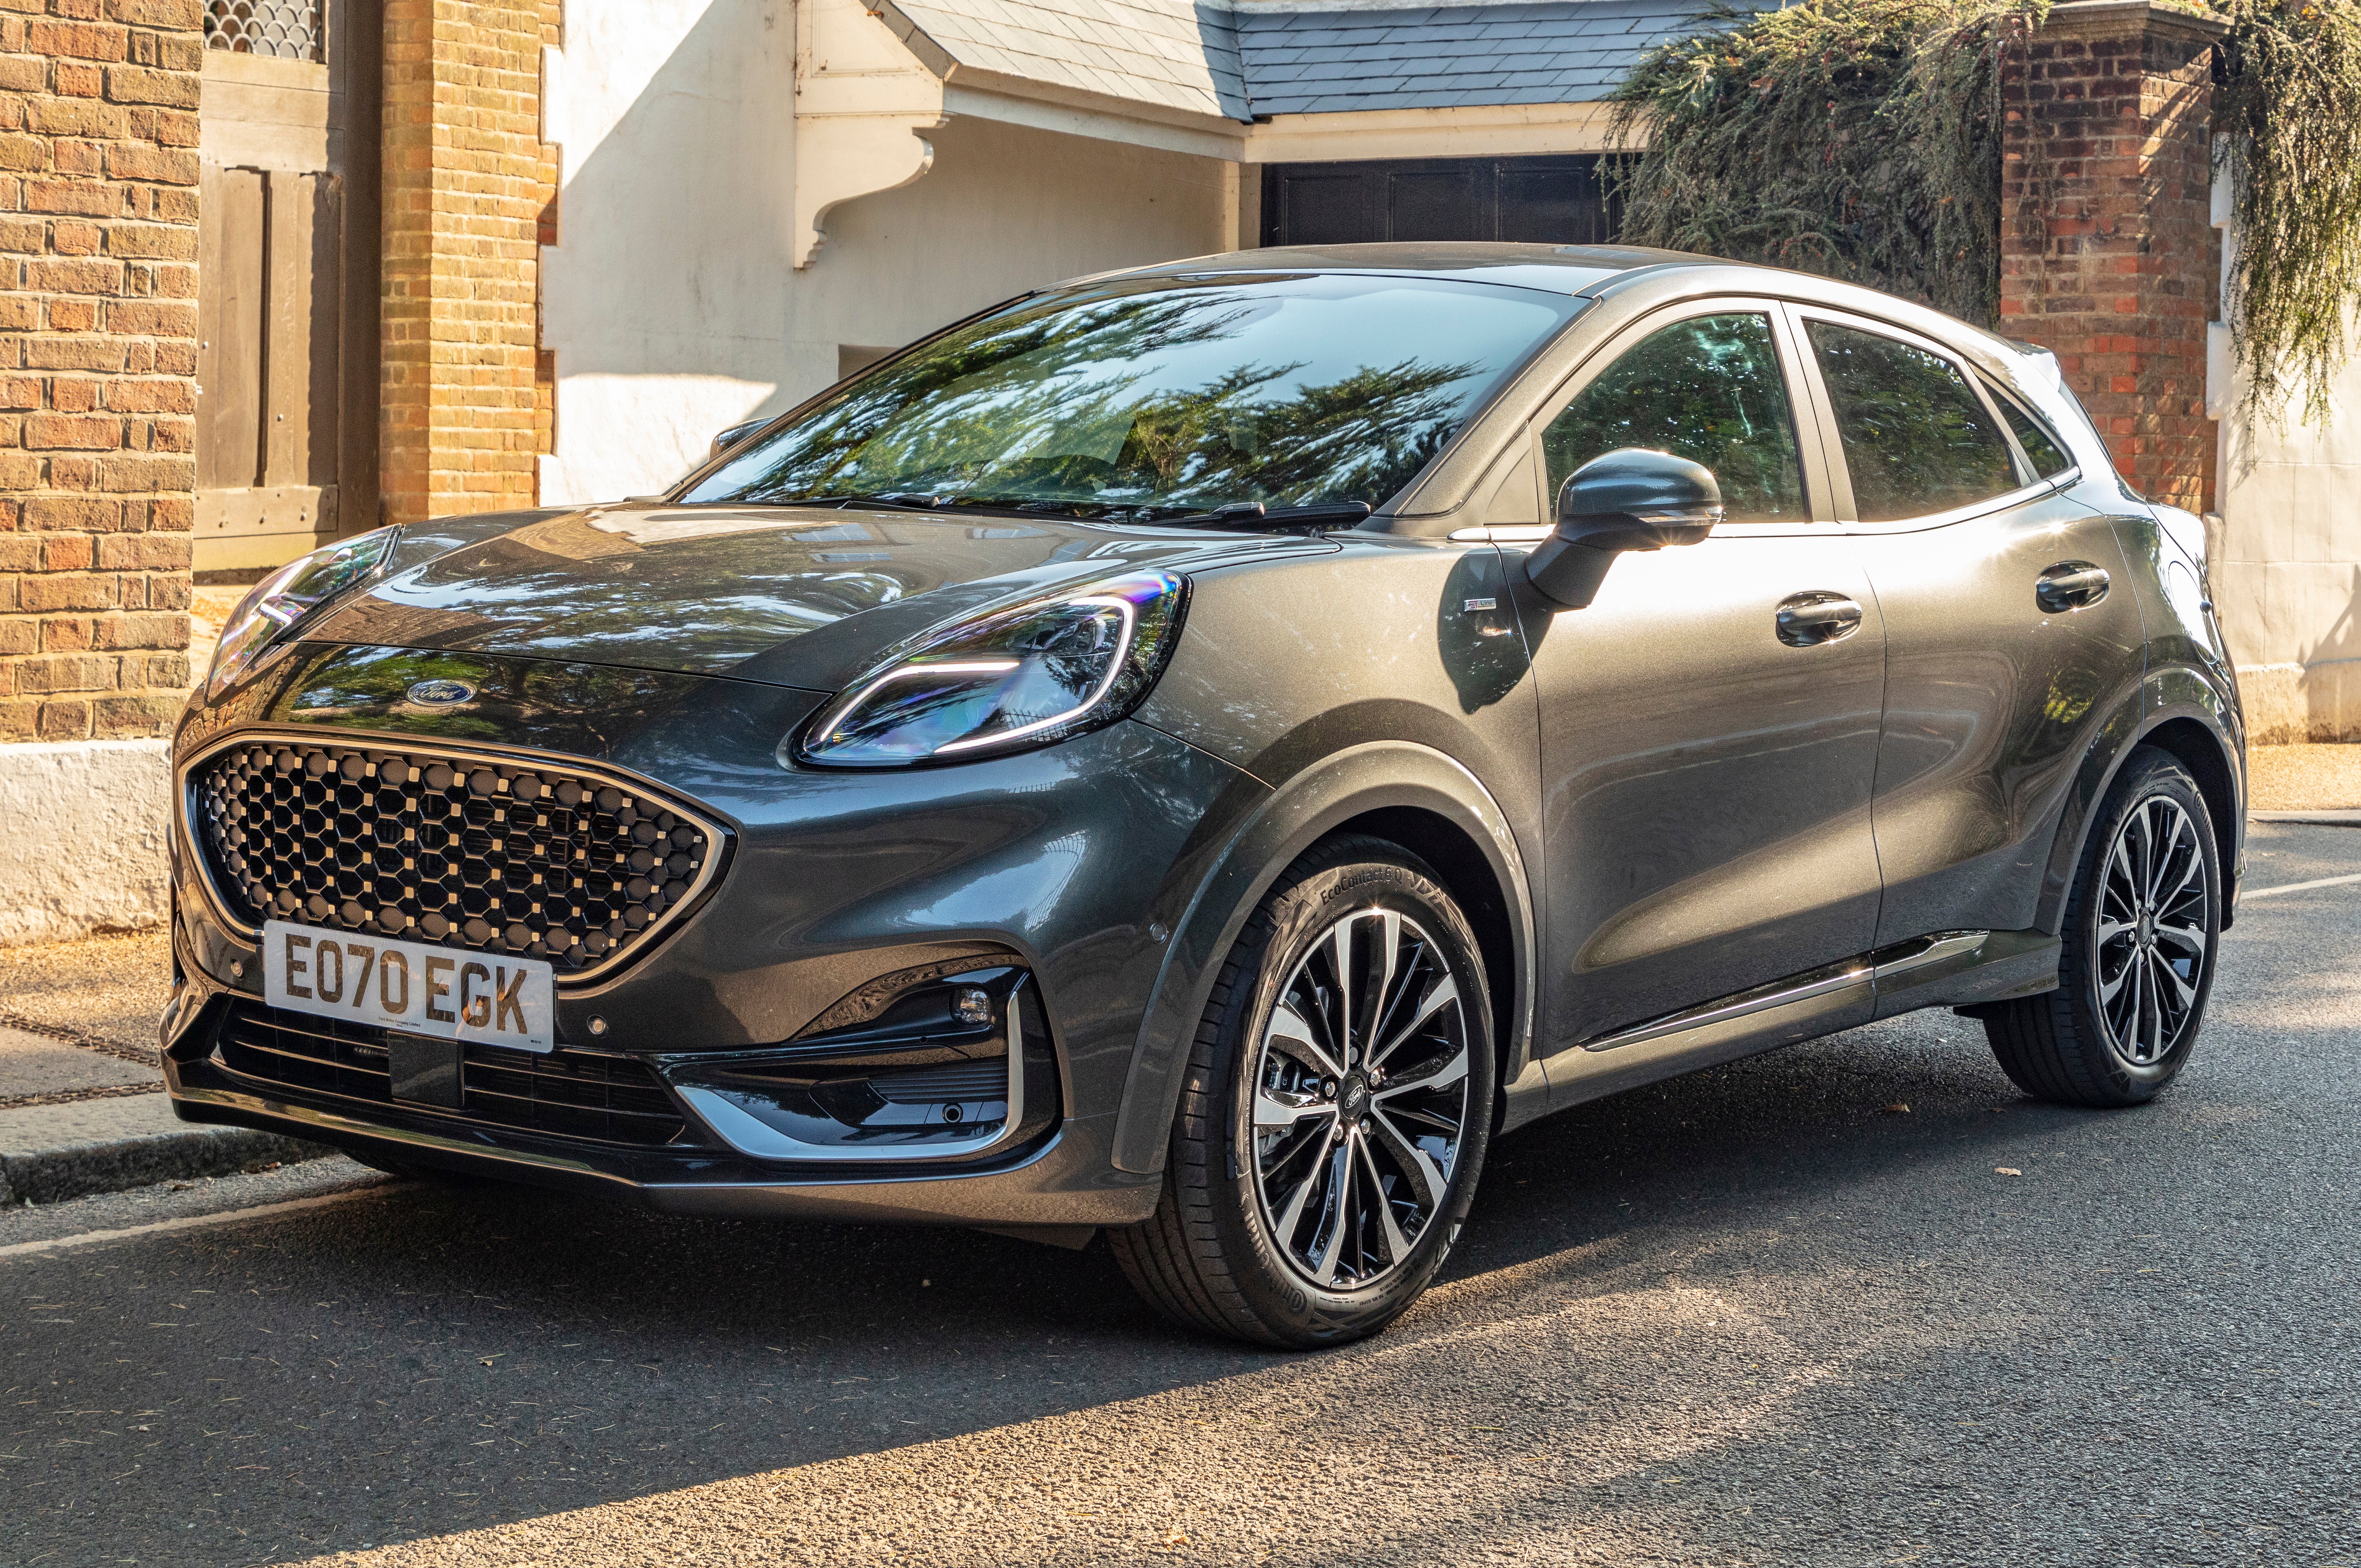
- The Ford Puma is the UK's favourite new car, with 48,340 sales in 2024.
- Volkswagen is Britain’s top-selling car brand, with 166,304 new sales in 2024.
- The Tesla Model Y is the world's best-selling EV.
- China registered over 30 million cars in 2024, making it the largest market in terms of global sales.
- The COVID-19 pandemic saw the USA experience one of the largest declines in new vehicle sales on record in 2020, with a year-on-year fall of 2.5 million vehicles.
- Toyota sells the most cars worldwide. In 2024, Toyota sold 10.8 million new vehicles globally.
- Grey is the UK's most popular car colour, followed by black and white.
- More than 7.6 million used cars were sold in the UK in 2024, a 5.5% increase from 2023.
Used Car Sales Overview
In 2025, the UK used car market recorded 1,996,116 transactions in Q2, representing a 1.7% increase on the same period a year earlier.
The market has now seen ten consecutive quarters of growth.
- In 2024 used car sales grew by 5.5% in the UK, with 8 straight quarters of growth. Over 7.6 million cars changed hands through the year.
- Demand for electric cars for sale has exploded, with a 57.4% growth in 2024 and accounting for 2.5% of the market.
- In the UK, used car transactions grew 5.1% in 2023 – a total of 7,242,692 vehicles were re-registered.
- Out of the 7,242,692 vehicles re-registered in the UK in 2023, only 1.6% (118,973 cars) were battery electric vehicles.
- In 2023, the top 3 used-car colours in the UK were black (1,549,954), grey (1,234,314), and blue (1,181,741).
- In 2020, the used car market fell 15% compared to 2019, with 6.7 million cars sold.
- 2021 used car sales were still 5.5% below the pre-pandemic five-year average, while 2022 sales fell by 8.5%, with 6,890,777 units changing hands as supply was still restricted.
How many used cars are sold each year?
In 2024, 7,643,180 used cars were sold in the UK – a 5.5% increase compared to 2023 and completing 8 straight quarters of growth in sales.
Want to know how much your road tax will be? Check out our guide to the latest VED car tax rates.

The Impact of Trump's Tariffs on Car Sales
US President Donald Trump has implemented a 25% tariff on all cars imported into the US - this is separate to the universal and so-called 'reciprocal' tariffs announced on April 2nd, levied on most goods imported into the US.
For US car buyers, it's possible that the price of imported vehicles will increase as dealerships pass on the additional costs imposed by the tariffs. Nearly half of the 16 million cars purchased in the US in 2024 were imports.
Trump has since softened the impact of the new tariffs by reducing the amount companies with US factories have to pay in import taxes on foreign parts. Parts sourced from China are not exempt.
Carmakers with US factories will also be eligible for credits for up to 15% of the value of vehicles assembled in the US.
The UK exported around 100,000 cars to the US in 2024, accounting for 16.9% of all UK cars exported that year. The US is the UK's second-largest car export market, with only the EU receiving more from the UK.
Impact of the UK-US Trade Deal on the Car Industry
The recent deal struck between the UK and US will see tariffs cut across a range of critical industries, including automotive. The UK can now export 100,000 vehicles to the US at a reduced tariff rate of 10%. The quota is around the number of vehicles the UK exported to the US last year.

UK Car Sales Statistics
- Most popular car: Ford Puma (48,340 registrations in 2024)
- Most popular EV: Tesla Model Y (32,862 registrations in 2024)
- New car sales in 2024: 1.953 million
- Largest sales year: 2016 (2.69 million new car sales)
UK Car Sales 2025
In 2025, carmakers have to contend with tougher government targets for EVs. The latest outlook for EV market share by the end of the year is 23.7%, well below the 28% target for 2025.
July 2025 Highlights
- In July 140,154 new cars were registered, this was down 5% YoY.
- Nearly half registered (47.3%) were petrol vehicles.
- BEV accounted for just over 20% of vehicles registered, whereas hybrid vehicles only accounted for 13%.
- Private sales figures fell 3% on last year's figures, while fleet sales fell 6.5%. Business sales saw an increase of 10%.
June 2025 Highlights
- Registrations grew for the second consecutive month, up 6.7%. This is the best June for sales since 2019.
- Across the first 6 months of the year, UK car sales are up 3.5% compared to the same period in 2024.
- Petrol and diesel cars accounted for just over half of new sales in June.
- Vehicles with an electrical component (BEVs, PHEVs and HEVs) accounted for 48.5% of the UK new car market in June, with 92,571 sold.
- 24.8% of new cars sold in June were BEVs.
- BEV market share for the first 6 months of 2025 sits at 21.6% – still far below the mandated 28% manufacturers need to reach by the end of the year.
May 2025 Highlights
- May was the second month (so far) in 2025 where the car market has grown – up 1.6% with 150,070 registrations.
- This was the best May performance since 2021. However, registrations in May 2025 were still 18.3% lower than in 2019.
- Fleets drove the growth in car sales in May, accounting for 60% of sales in the month. Private buyers were more reluctant, with private sales falling for the second month in a row (by 2.3%).
- BEV registrations were up 25.8% YoY, with 32,738 units registered and taking a market share of 21.8%.
- Petrol remains the most popular fuel type, but registrations fell 12.8% YoY.
April 2025 Highlights
- April new car registrations fell 10.4% YoY.
- 120,331 new cars were registered. Sales were more than 25% below April 2019 (pre-pandemic).
- Private buyers fell 7.9%, alongside a decline in business (-10.9%) and fleet (-11.9%) demand.
- Despite BEVs continuing a strong 2025 with April sales up 8.1% (24,588 registrations), market share is still below the Zero Emission Vehicle Mandate requirement. BEV market share for April was 20.4%.
March 2025 Highlights
- Registrations increased by 12.4% YoY, with 357,103 new cars sold. March was the first month of 2025 that registrations have increased YoY.
- All powertrains with an electrical component (BEVs, HEVs and PHEVs) saw strong YoY sales increases.
- Diesel sales were down 10.1% YoY, with 20,967 units.
- Petrol cars had roughly equal YoY performance, with 176,847 sales - a 0.4% drop compared to March 2024.
February 2025 Highlights
- February saw the UK's new car market shrink by 1.0% YoY, with 84,054 new registrations. This marked the fifth consecutive monthly decline in the UK car market.
- Petrol car sales were down 17.3% YoY, with 39,865 sold. Petrol cars still accounted for 47.4% of all new car sales in February 2025.
- BEV sales remained comparatively strong, with a 41.7% uplift compared to the same month in 2024. A total of 21,244 BEVs were sold in February.
- EVs accounted for 1 in 4 new car sales in February 2025.
- Tesla sales improved by 20.7% YoY in February, with the Model 3 and Model Y ranking as the the second and third most popular new cars for the month. Tesla sales were 11.25% higher YoY in the first two months of 2025.
January 2025 Highlights
- The UK's new car market contracted by 2.5% in January 2025 compared to 2024.
- EV sales remained robust, with a 41.6% YoY increase.
- Over a fifth of new car sales in January were EVs - a total of 29,634 were sold.
- Tesla sales fell 7.8% YoY in January in the UK, following a wider trend of declining sales for the EV brand across Europe.

UK Car Sales by Fuel Type 2025
The latest new car sales statistics UK for 2025
Month
- January
- February
- March
- April
- May
- June
- July
Diesel
- 8,625
- 4,241
- 20,967
- 6,381
- 7,792
- 10,716
- 8,018
Petrol
- 70,075
- 39,865
- 176,847
- 58,733
- 71,291
- 88,029
- 66,271
BEV
- 29,634
- 21,244
- 69,313
- 24,558
- 32,738
- 47,354
- 29,825
PHEV
- 12,598
- 7,273
- 33,815
- 14,073
- 17,898
- 21,382
- 17,489
HEV
- 18,413
- 11,431
- 56,161
- 16,586
- 20,351
- 23,835
- 18,551
UK Car Sales 2024
UK car sales increased by 2.6% in 2024. This growth in UK new car sales was largely driven by cars with an electrical component, with EVs (+21.4%) plug-in hybrids (+18.3%) and hybrids (+9.6%) all experiencing strong sales in 2024.
This was also influenced by the zero-emission vehicle mandate, which requires manufacturers to ensure that 22% of their sales were fully electric vehicles in 2024, increasing to 28% in 2025.
2024 UK Car Sales Highlights:
- 2024 was the best year for UK car sales since the pandemic, with 1,952,778 sales. Sales increased 2.6% YoY.
- Petrol and diesel-powered car sales fell by 4.4% and 13.6% respectively, as drivers switched to either hybrid or fully electric vehicles.
- The average new car CO2 fell by 6.2% to 102.1g/km in 2024 - driven by higher EV sales.
- EVs made up 19.6% of new car sales.
- Used car sales increased more than 5% compared to 2023.
UK Car Market Trends
It's clear that diesel-powered cars are falling out of favour with the British public. Diesel car sales fell by 13.6% in 2024, accounting for just 6.3% of new cars sold through the year.
While petrol cars still command the majority of the new car registration market (52.2% in 2024) the strongest performance gain in 2024 was from electric-powered cars - EVs and hybrids. In 2024, new BEV sales were second only to petrol vehicles - they commanded a 19.6% share of the UK new car market.
Electric car production in the UK slowed in late 2024, driven by flagging demand in Europe and the factories retooling for new models. Across all cars, production fell by more than 15% in October compared with the previous year, while EV and hybrid production dropped by a third.
Despite this, EVs continue to grow in popularity and started 2025 with a more than 40% YoY increase in sales for January.
How many cars are sold in the UK each year?
Before the pandemic, the UK was averaging over 2 million new car sales every year (using data back to 2000). Since Covid-19 disrupted global supply chains, car sales have been notably lower than that, but numbers are increasing; 2024 saw over 1.95 million new cars sold.
At this point it is unclear what impact a road pricing taxation system would have on annual sales.
Are UK car sales falling?
New car sales in the UK grew overall in 2024, but petrol - the most popular fuel type - saw a drop of 4.4% in sales. Petrol-fuelled cars still accounted for 52.2% of new cars registered in 2024, but electric-powered cars grew their market share.
The UK Used Car Market
The second-hand car market in the UK has seen strong performance in recent years. The UK's used car market hit a 5 year high in Q1 2024, with almost 2 million units sold. It's also the 5th quarter of successive growth, with the used car market growing by 6.5% - the strongest start to a year since 2019 (before the pandemic).
In total, 7.6 million used car transactions took place in the UK in 2024, a 5.5% increase YoY. By the end of the first year of ownership, a new car will typically have lost around 40% of its value.
Q1 Used Car Sales:
- 1.968 million used cars changed hands in Q1 2024 - the fifth quarter of successive growth and a 6.5% increase YoY.
- The South East is the region with the most transactions, at 289,011.
- 2023 saw more than 7.24 million used cars change hands - 5.1% higher than in 2022.
- Used BEV sales nearly doubled to 118,973 - but despite growth of 90.9% YoY, electric cars made up just 1.6% of the second-hand car market in 2023.
Q2 Used Car Sales:
- The used car market grew by 7.2%, continuing the trend of quarterly growth.
- Used EV sales grew by 52.6%, pushing used EVs to their highest-ever market share of 2.4%.
- In the first half of 2024, used car sales grew by 6.8% YoY - the market is now only 3% below pre-pandemic levels.
Q3 Used Car Sales:
- 1,965,811 used cars were sold in the UK in Q3 2024.
- The most popular region for used car transactions was the South East, with 285,020 transactions.
Q4 Used Car Sales:
- 1,746,051 used cars were sold in the UK in Q4 2024 - a 4.0% YoY increase.
- The South East was once again the most popular region for used car transactions, with more than 255,000 transactions.
- The lowest number of used car transactions occurred in Wales in Q4, at 91,759.
UK Used Car Market Trends
The used cars market in the UK grew 6.5% in Q1 2024. One of the main trends to be aware of is the growing popularity of used EVs - Second-hand EVs enjoyed a surge in transactions in 2024, with 188,382 units changing hands and taking a 2.5% share of the used car market. Used EV sales rose 57.4% YoY.
As more buyers make the switch to electric vehicles, the number of used EVs changing hands is also likely to rise.
What are the most popular used cars for UK drivers?
The Ford Fiesta is the most popular used car in the UK. Over 300,000 changed hands in 2024.
The most popular used car models in the UK in 2024 were:
- Ford Fiesta - 306,207
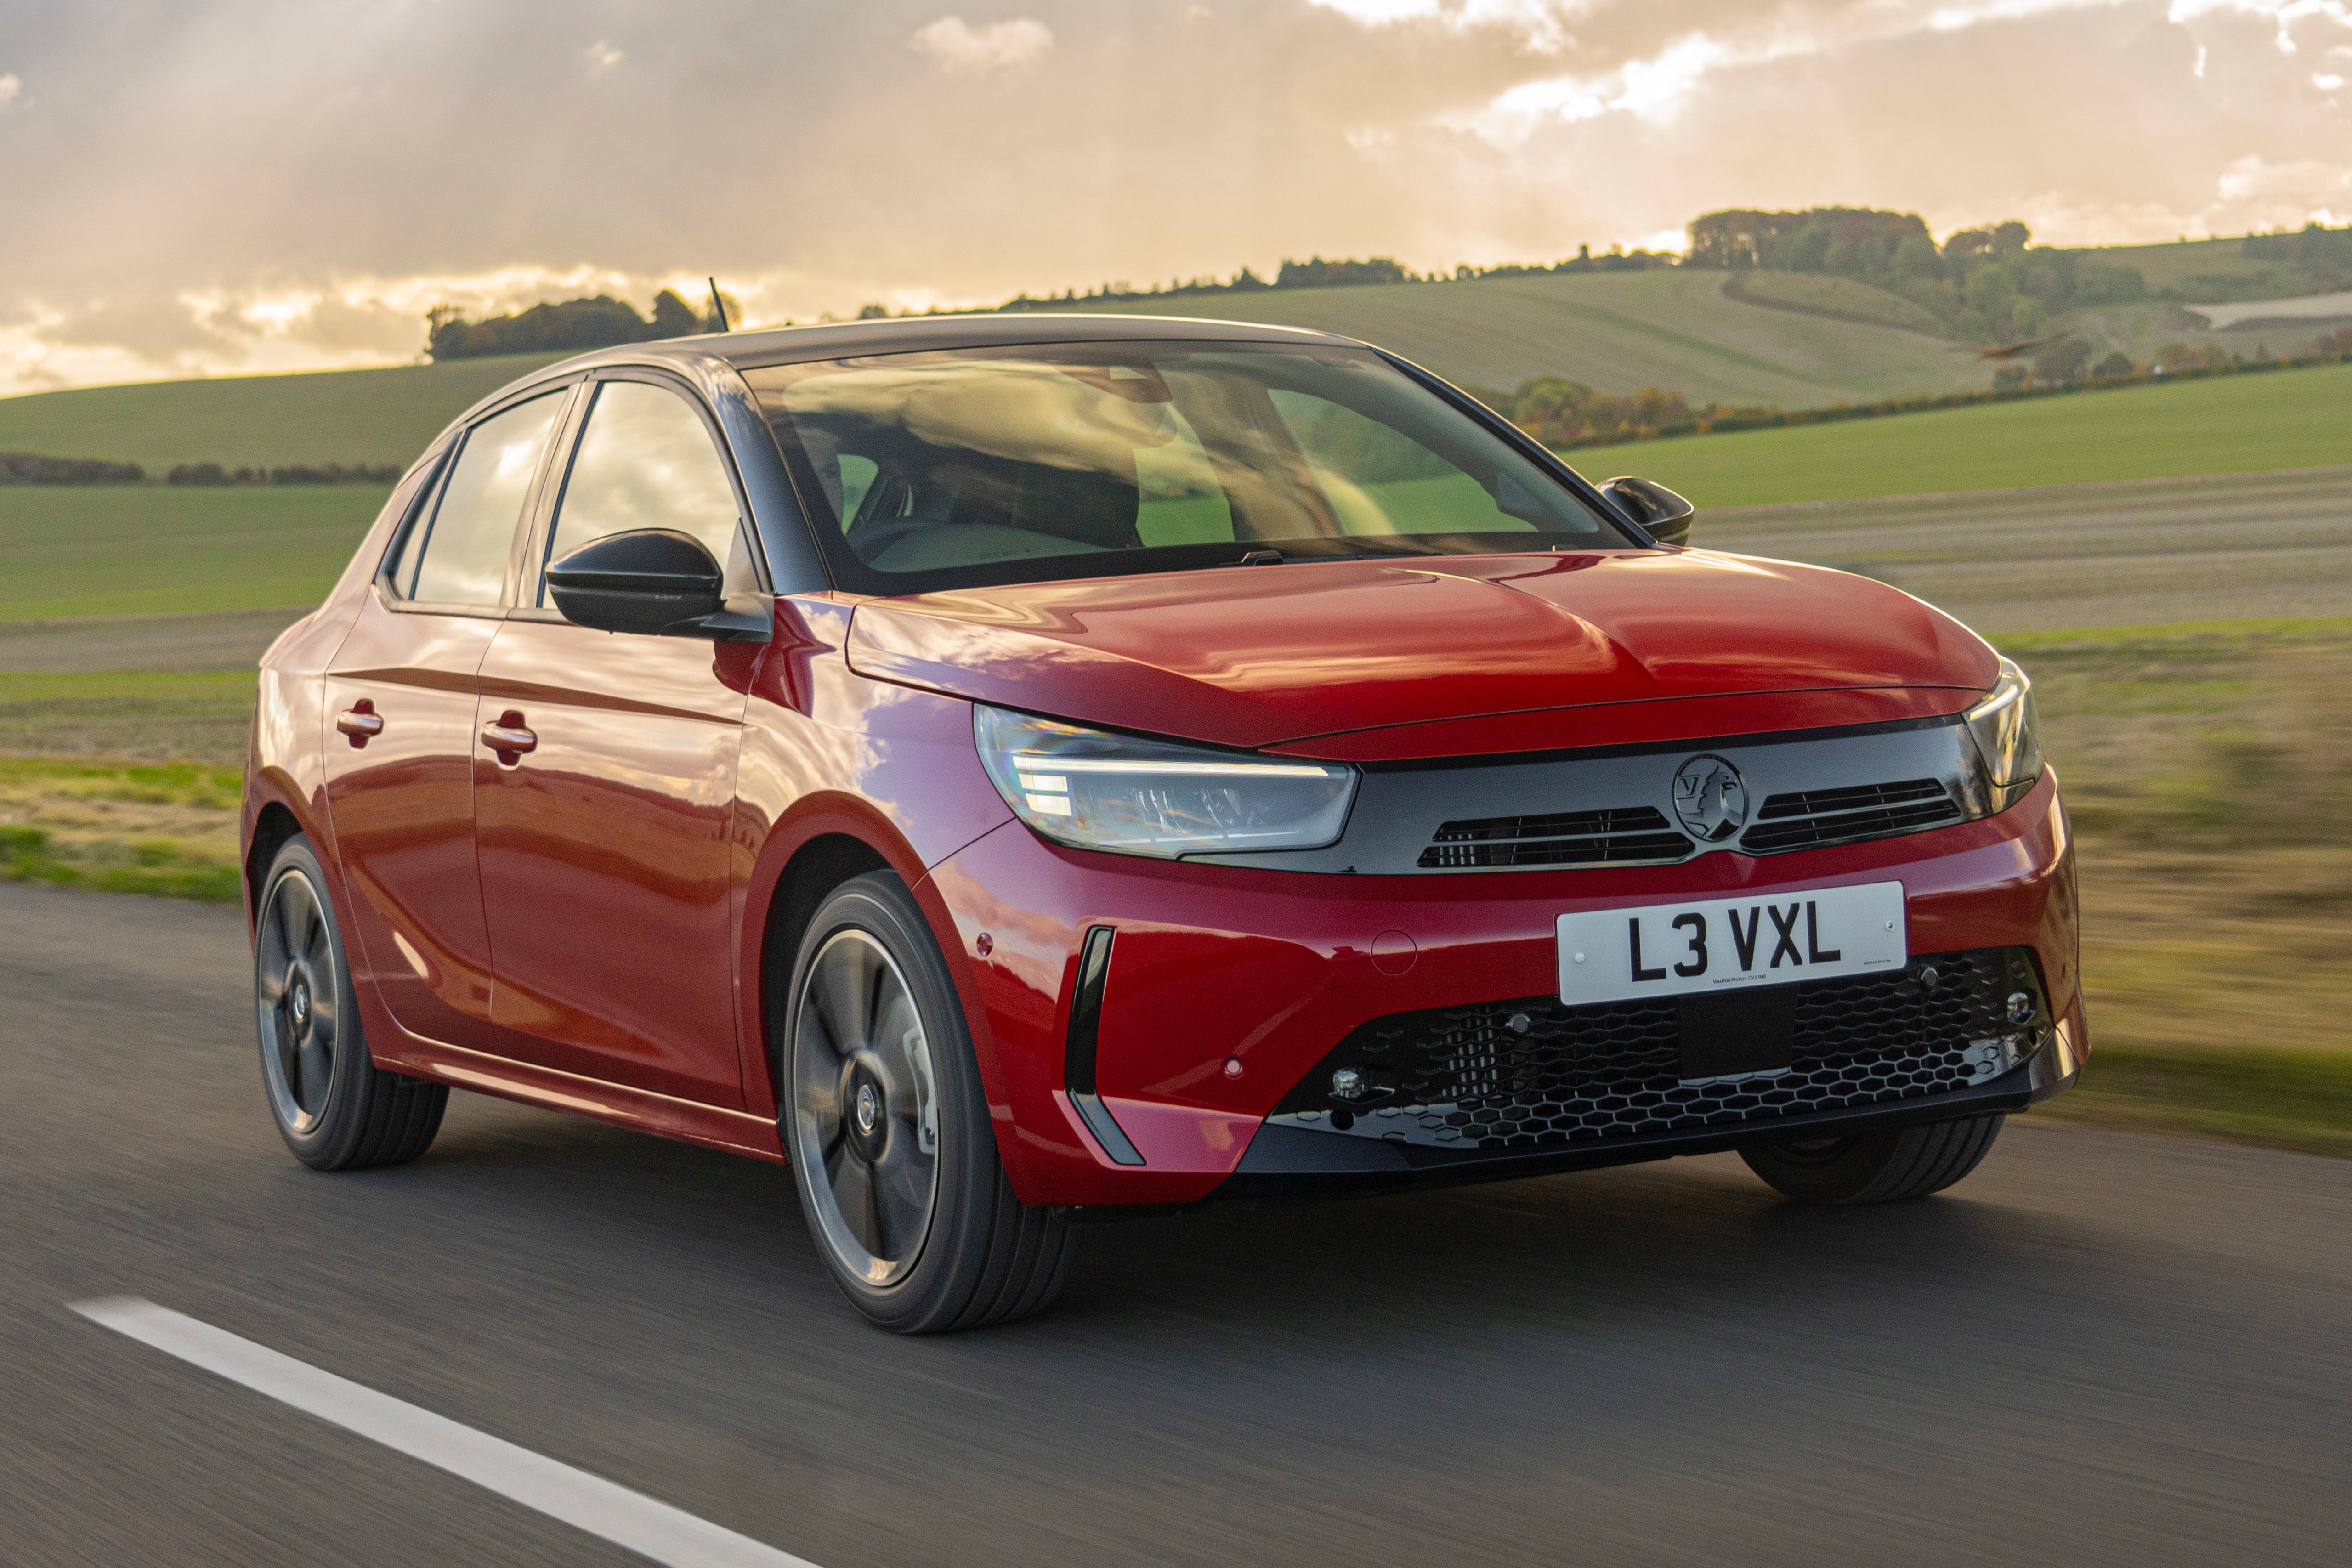
- Vauxhall Corsa - 252,761
- Volkswagen Golf - 231,440
- Ford Focus - 228,220
- MINI - 160,516
- Vauxhall Astra - 159,495
- BMW 3 Series - 158,674
- Volkswagen Polo - 151,786
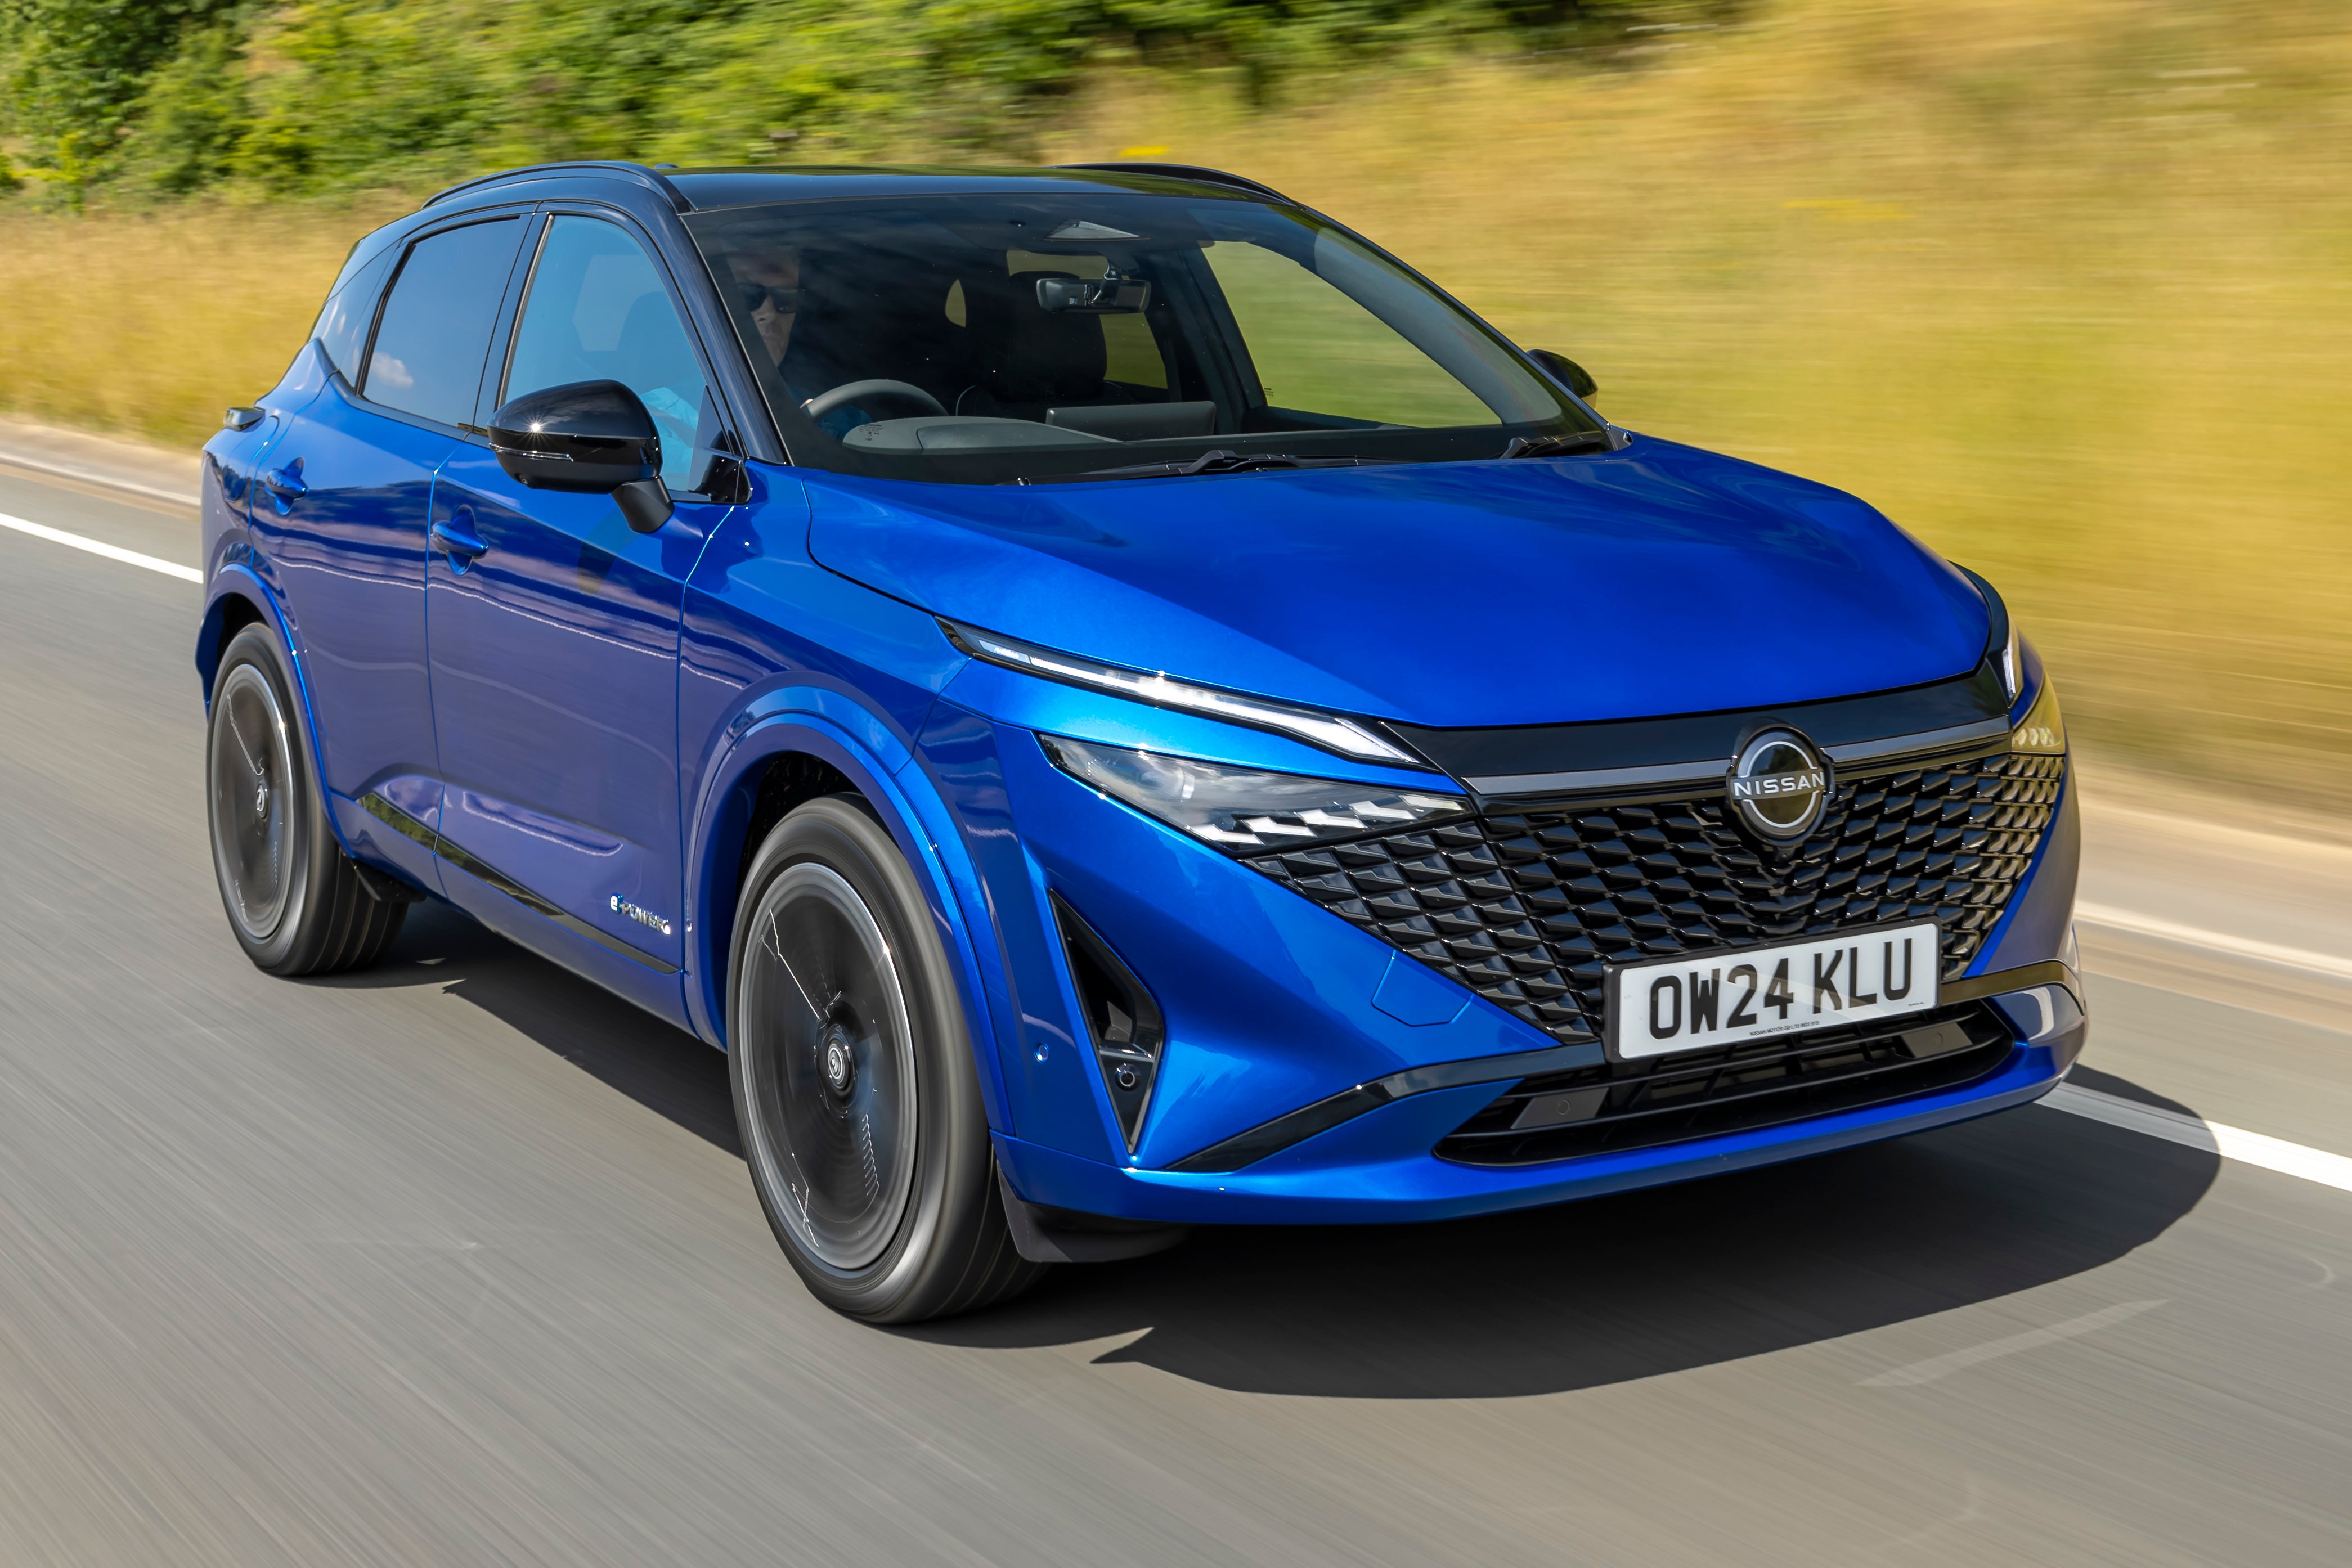
- Nissan Qashqai - 138,810
- BMW 1 Series - 125,440
UK Car Sales by Fuel Type 2024
Month-by-month new car sales in UK for 2024 by fuel type
Month
- January
- February
- March
- April
- May
- June
- July
- August
- September
- October
- November
- December
Diesel
- 9,348
- 4,995
- 23,312
- 8,649
- 9,220
- 10,696
- 8,708
- 5,165
- 17,556
- 8,961
- 9,434
- 7,060
Petrol
- 81,905
- 48,001
- 177,019
- 74,877
- 81,058
- 91,227
- 76,879
- 42,872
- 137,793
- 72,681
- 70,317
- 59,455
BEV
- 20,935
- 14,991
- 48,388
- 22,717
- 26,031
- 34,034
- 27,335
- 19,113
- 56,387
- 29,802
- 38,581
- 43,656
PHEV
- 11,944
- 6,098
- 24,517
- 10,493
- 11,866
- 16,604
- 13,149
- 5,786
- 24,486
- 13,832
- 15,687
- 12,716
HEV
- 18,744
- 10,801
- 44,550
- 17,538
- 19,503
- 26,702
- 21,446
- 11,639
- 39,017
- 19,012
- 19,591
- 17,899

New Car Sales UK
How many new cars are sold each year in the UK?
Year
- 2024
- 2023
- 2022
- 2021
- 2020
- 2019
- 2018
- 2017
- 2016
- 2015
- 2014
- 2013
- 2012
- 2011
Number of new car registrations
- 1,952,778
- 1,903,054
- 1,614,063
- 1,647,181
- 1,632,064
- 2,311,140
- 2,367,147
- 2,540,617
- 2,692,786
- 2,633,503
- 2,476,435
- 2,264,737
- 2,044,609
- 1,941,253
What are the most popular cars in the UK?
Hatchbacks and SUVs are typically the UK's most popular cars - in 2024 and 2023, the Ford Puma topped the best-sellers list. In 2022, the most popular car was the Nissan Qashqai, and in 2021, it was the Vauxhall Corsa. For more detailed information, see our rundown of the UK's best-selling cars.
These are the latest UK car sales figures by model for 2024:
- Ford Puma (48,340)
- Kia Sportage (47,163)
- Nissan Qashqai (42,418)
- Nissan Juke (34,454)
- Tesla Model Y (32,862)
- Volkswagen Golf (32,370)
- Hyundai Tucson (32,174)
- MG HS (30,207)
- Volvo XC40 (30,202)
- Volkswagen Polo (28,981)
The best-selling cars in the UK 2023
The Ford Puma was the best-selling car in the UK in 2023, proving that while SUVs may seem all-encompassing, small hatchbacks are still in demand.
- Ford Puma (49,591)
- Nissan Qashqai (43,321)
- Vauxhall Corsa (40,816)
- Kia Sportage (36,135)
- Tesla Model Y (35,899)
- Hyundai Tucson (34,469)
- MINI (33,385)
- Nissan Juke (31,745)
- Audi A3 (30,159)
- Vauxhall Mokka (29,984)
The best-selling cars in the UK 2022
The Nissan Qashqai was the UK's best-selling car in 2022, with 42,704 sales. That's 6,794 more than the next best-selling car, the Vauxhall Corsa, which topped the charts in 2021.
- Nissan Qashqai (42,704)
- Vauxhall Corsa (35,910)
- Tesla Model Y (35,551)
- Ford Puma (35,008)
- MINI Hatch (32,387)
- Kia Sportage (29,655)
- Hyundai Tucson (27,839)
- Volkswagen Golf (26,558)
- Ford Kuga (26,549)
- Ford Fiesta (25,070)
The best-selling cars in the UK 2021
The Ford Fiesta normally tops the list of the best-selling cars in the UK, but in 2021 the Vauxhall Corsa took the crown. The hatchback sold more than 40,000 units in a market hit by a global semiconductor shortage and the ongoing Covid-19 pandemic.
- Vauxhall Corsa (40,914)
- Tesla Model 3 (34,783)
- MINI Hatch (31,792)
- Mercedes-Benz A-Class (30,710)
- Volkswagen Polo (30,634)
- Volkswagen Golf (30,240)
- Nissan Qashqai (29,922)
- Ford Puma (28,697)
- Kia Sportage (27,611)
- Toyota Yaris (27,415)
UK car sales by fuel type 2023 and 2022
Percentage of new petrol, diesel and electric passenger car sales
Fuel type
- Petrol
- Mild hybrid petrol
- Diesel
- Mild hybrid diesel
- Pure electric
- Plug-in hybrid
- Self-charging hybrid
2023 new car sales
- 720,124
- 270,482
- 66,610
- 66,096
- 286,846
- 129,149
- 222,655
2023 market share
- 40.9%
- 15.4%
- 3.8%
- 3.8%
- 16.3%
- 7.3%
- 12.6%
2022 new car sales
- 682,473
- 219,701
- 82,981
- 72,343
- 267,203
- 101,414
- 187,948
2022 market share
- 32.8%
- 10.3%
- 3.1%
- 3.6%
- 32.9%
- 6.5%
- 10.7%
Used Cars Sales Statistics UK
The used car market UK year-on-year sales
Year
- 2024
- 2023
- 2022
- 2021
- 2020
- 2019
- 2018
- 2017
- 2016
Number of used cars sold
- 7,643,180
- 7,242,692
- 6,890,777
- 7,530,956
- 6,752,959
- 7,935,105
- 7,945,040
- 8,113,020
- 8,200,000
UK Car Sales Figures by Manufacturer
Best selling new cars by manufacturer in the UK 2023 vs 2022
Manufacturer
- Volkswagen
- Ford
- Audi
- BMW
- Toyota
- Kia
- Vauxhall
- Nissan
- Mercedes-Benz
- Hyundai
2023 Sales
- 162,087
- 144,072
- 137,485
- 111,734
- 109,864
- 107,765
- 100,417
- 89,460
- 87,782
- 87,112
2022 Sales
- 131,850
- 126,826
- 110,144
- 108,264
- 102,181
- 100,191
- 83,691
- 76,711
- 80,910
- 80,419
YoY % Change
- 22.93
- 13.60
- 24.82
- 2.86
- 7.52
- 7.56
- 19.99
- 16.62
- 8.49
- 8.32
UK used car sales by model 2022
How many used cars are sold each year? The best selling used cars in the UK 2022
Make and model
- Ford Fiesta
- Vauxhall Corsa
- Volkswagen Golf
- Ford Focus
- Vauxhall Astra
- MINI
- BMW 3 Series
- Volkswagen Polo
- Audi A3
- BMW 1 Series
Number sold
- 288,639
- 229,454
- 216,227
- 213,821
- 165,011
- 158,710
- 155,264
- 137,517
- 114,801
- 112,312
Electric and Hybrid Cars Sales Statistics
Electric and hybrid cars are becoming more and more popular across the world. Many governments, including the UK and EU countries, are preparing for the full transition to electric vehicles.
In the UK in 2014, just 2.2% of all new passenger cars were electric. This figure grew to 16.6% by 2022, and in 2024 BEVs accounted for 19.6% of new car sales, up from 16.5% in 2023. Sales continue to grow as the UK nears the 2030 ban on new petrol and diesel-powered cars. In 2022, the growing share of electric-powered vehicles meant that the UK's average new car CO2 emissions fell 6.9% to 111.4 g/km - the lowest in history.
Electric vehicles saw strong global sales in 2024, with more than 17 million units sold. The majority of electric cars were sold in China accounting for 65% of global EV sales. Europe accounted for approximately 17% of global sales.
- Electric car registrations continued to rise in June 2025, with 191,316 new EVs hitting the road – a 6.7% increase on the 179,263 recorded during the same month last year.
- In 2024, 19.6% of new passenger cars sold in the UK were fully electric cars (BEVs) – PHEVs and HEVs were 8.6% and 13.4% respectively.
- Electric vehicles and hybrids accounted for more than 16% of total 2023 U.S. light-duty vehicle sales. A total of 1,189,051 electric vehicles were sold, this is the first time the figure has surpassed a million.
- As of mid 2025 hybrid electric models comprised the largest share of new car registrations in the EU, at 34.7% with over 2.25 million units sold. France and Spain lead growth increases of around 30%, while Germany and Italy had more modest gains of 10 - 11%.
- In China, electric and hybrid-electric vehicles accounted for 40.9% of new car sales in 2024, up from 36% in 2023.
- In Japan, hybrid cars continued to dominate the market. New hybrid registrations reached 2,040,181 units, a 9.2% increase from 2023 and surpassing the 2 million mark for the first time
For more information and the latest EV statistics, visit our Electric Car Statistics page.
What percentage of new car sales are electric?
In 2024, 19.6% of new cars sold were BEVs. In total, cars either partly or completely powered by electric - BEVs, HEVs and PHEVs - accounted for 41.6% of the UK's new car market share in 2024.
What is the best-selling electric car in the UK?
The Tesla Model Y is the best-selling electric car (EV) in the UK having notched up 32,862 sales in 2024. This was followed by the Audi Q4 e-tron (17,622 sales), Tesla Model 3 (17,425 sales), MG4 (15,651 sales) and BMW i4 (12,953 sales).

International Car Sales Statistics
- Around 10.6 million cars were sold in the European Union in 2024 – a 0.8% increase compared to 2023.
- In the first half of 2025 new car registrations in the EU were 5,576,568, which represents a 1.9% decrease compared to the same period in 2024.
- In 2024, China retained its position as the largest single-country car market in the world with 31.4 million vehicle sales.
- Light vehicle sales in the US reached around 15.9 million in 2024, making it the world's second-largest new car market.
- India overtook Japan as the third largest car market in the world – 4,101,700 vehicles registered in India versus Japan’s 3,992,700 vehicle sales in 2023.
- In 2023, India’s car market grew by 8.1% from 3,792,400 in 2022 to 4,101,700 in 2023.
- 2019 was the best year for the European Union, the UK, and EFTA countries in terms of car sales. A combined 15,805,800 vehicles were sold in those markets.
- Mexico reported 1,360,100 light passenger vehicle sales in 2023.
- Sales of light vehicles in Brazil grew 11% to 2,180,200 in 2023.
Car Sales in Europe
Car sales increased slightly in the EU in 2024 compared to 2023, up 0.8% to 10.6 million units. While petrol remains the most popular power source for European drivers (accounting for 33.3% of sales) HEVs represented nearly a third (30.9%) of sales in the EU in 2024. Just 13.6% of new cars sales were BEVs in 2024.
- The opening 4 months of 2025 saw car sales in the EU fall by 1.2% compared to the same period in 2024.
- EU new car registrations in April, however, increased by 1.3% YoY.
- The combined market share of petrol and diesel cars has declined in 2025. Petrol and diesel market share for January-April 2025 sat at 38.2% - down from 48.4% over the same period in 2024.
US Car Sale Statistics
- Across retail and fleet sales approximately 13.3 million units were sold in the U.S. in 2024, representing a 4.6% increase compared to 2023.
- The USA experienced one of the biggest declines in new vehicle sales in 2020, with a year-on-year fall of 2.5 million vehicles.
- 1.277 million automotive vehicles were sold in the US in July 2024, a drop from the same month in 2023, where 1.314 million were sold.
What percentage of US car sales are electric?
2023 was the first time EV sales surpassed 1 million units for a single year in the U.S. New car shoppers bought 1.2 million electric cars which puts the EV share of U.S. new car sales in 2023 at 7.6%, an increase of 5.9% from 2022.
In 2024 EVs accounted for 10% of vehicle sales in the US, with 1.56 million electric vehicles sold. In Q1 of 2025, 9.6% of vehicle sales were electric vehicles.
China Car Sale Statistics
- China is the largest new car market in the world, selling an averaging over 25 million cars sold every year.
- In 2023, electric and hybrid-electric vehicles accounted for 36% of new car sales in China.
- Asia was BMW’s biggest market, with 1,070,142 vehicles sold in 2023 - China alone accounted for 824,932 sales.
- Tesla sold 603,304 EVs in China in 2023. The automaker faced stiff opposition from China’s BYD which sold 1,262,065 BEVs.
- In April 2025, car sales in China rose for the third straight month, totalling 1.78 million. Sales in April were up 14.8% compared to 2024. For the first 4 months of 2025, 6.97 million cars have been sold in China – 8.2% higher than the same period in 2024.
Germany Car Sales Statistics
- In 2024 the total new passenger car registrations was 2,817,331, a 1% decline from the 2,844,609 registered in 2023.
- 380,609 BEVs were registered, accounting for 13.5% of the market, a sharp fall from 18.4% in 2023 and 17.7% in 2022.
- Plug-in Hybrids (PHEVs): 191,905 registrations, up compared to 2023, representing 6.8% of the 2024 market.
- Petrol vehicles accounted for 35.% of of cars registers in 2024, up from 34.4% in 2023.
- Sales of diesel-powered vehicles had just a small increase from 17.1% in 2023 to 17.2% in 2024.
Australia Car Sales Statistics
- In total there were 1,237,287 new vehicles sold in Australia in 2024. This marked a 1.7% increase over 2023’s 1,216,780. This set a new all time high - 2017 held the previous highest sales record of 1,189,116 vehicles.
- Nearly 1 in 10 cars sold (9.65%) were electric vehicles, up from 7.2% of all car sales in 2023.
- Toyota was the top-selling car brand in 2024 for the 22nd consecutive year, selling 241,296 vehicles.
- In 2023 588,622 new cars in Australia were petrol-powered, which represents 48.4% of total car sales.
- 2,324,805 used cars were sold in Australia in 2024, marking a 12.% increase in 2023.
- Almost 1 in 10 new cars bought in 2024 in Australia are EVs - EV sales have increased 150% since 2022.
- The Tesla Model Y is the most popular new EV in Australia, accounting for 20% of all electric car sales in the country.
Canada Car Sales Statistics
- 253,322 new passenger cars were registered in Canada in 2023, in 2024 there was a decrease in car registrations of 2.4%.
- 1,485,948 light trucks were sold in Canada in 2023, 15.5% higher than the previous year’s 1,285,829 vehicles sold. In 2024, 62.9% of registrations were SUVs and light trucks.
New Zealand Car Sales Statistics
- A total of 128,828 new vehicles were registered in New Zealand in 2024, marking a 13.5% drop from 2023's figure of 149,040.
- Toyota led the market with 20,705 new vehicle registrations in 2024, retaining the top brand position despite a 5.5% year-over-year decline.
- For 2025 YTD Battery Electric Vehicles (BEVs) made up 6.1% of sales, up from 4.3% in 2024, Plug-in Hybrid Electric Vehicles (PHEVs) made up 5.6% of sales, up from 2.1% in 2024 and Petrol/Diesel (ICE): made up approximately 56.6% of sales, down from around 67.8% in 2024.
Ireland Car Sales Statistics
- In 2024, 121,195 new vehicles were registered in Ireland, a 1% decline from 2023.
- Of these registered vehicles, Petrol remained the post popular taking 30.31% of the market, where Diesel took 22.80%.
- Looking at EVs, 20.92% were sales of hybrid vehicles, 14.41% BEVs and 10.02% PHEVs.
- In 2024, sales of new electric cars in Ireland fell to 17,459 vehicles, down from 22,789 in 2023 (but still higher than the 15,678 recorded in 2022)
- Electric, Hybrid, and Plug-in electric hybrid accounted for 45.5% of the new car market in Ireland.
Car Sales in South Africa Statistics
- In 2024, 515,712 new vehicles were registered in South Africa - a 3% decline compared with 2023, when 532,500 units were sold.
- South Africa registered 15,611 new energy vehicles (NEVs) — including battery electrics, plug-in hybrids, and traditional hybrids — which made up around 3% of total new vehicle sales.
Singapore Car Sales Statistics
- In 2024, Singapore saw a total of 43,022 new car registrations, a 42.3% surge compared to 2023's 30,225 registrations.
- BYD, a Chinese electric vehicle brand, became Singapore’s best-selling carmaker in 2024, with 6,191 units sold and a 14.4% market share, overtaking long-standing leader Toyota.
- Toyota ranked second in 2024, with 5,736 vehicle sales.
- Tesla sold 2,384 vehicles in 2024 - a significant improvement over 2023, but still lagged behind both BYD and Toyota.
India Car Sales Statistics
- In 2024, India recorded 25 million new vehicle sales, a record high and an 11.6% year-on-year increase over 2023.
- Maruti Suzuki sold 1,755,423 new passenger vehicles in India in 2024, capturing a 40.9% market share, the highest among all brands.
- Petrol vehicles remain the most popular, accounting for 57.5% of total new passenger vehicle registrations.
Vehicle sales by country
Largest global new vehicle markets by sales in 2022
Country
- China
- USA
- Japan
- India
- Germany
- Brazil
- South Korea
- UK
- France
- Canada
New vehicle sales
- 23,563,247
- 13,689,240
- 4,203,712
- 3,780,870
- 2,651,574
- 1,957,834
- 1,672,256
- 1,615,219
- 1,598,976
- 1,524,379
Difference on 2021
- +10%
- -8%
- -5%
- +23%
- +1%
- -1%
- -2%
- -2%
- -8%
- -7%
Brand Performance
Who is the leading car manufacturer in the world?
Toyota is the world's best-selling automaker for the fifth year running. In 2024 sold 10.8 million vehicles globally in 2024, down from 11,233,039 vehicles in 2023. Volkswagen group remained in second place, selling approximately 9 million vehicles worldwide, a decrease from 2023's 9.24 million.
In 2022, Toyota sold more than 9.5 million vehicles, followed by Volkswagen (8.2 million) and Hyundai/Kia (6.8 million).
Toyota has an accomplished range of 4x4 and hybrid vehicles. The Hilux pick-up is a global leader when it comes to 4x4 vehicles, while the Corolla is one of the best-selling hybrid cars worldwide.
In the UK, Toyota has sold 52,058 new cars so far in 2025, representing 4.04% of the market. This is less than 2024 at 58,501 for the same period.
Volkswagen Group includes Skoda, Audi, SEAT and Volkswagen. VW's growth has traditionally been driven by the Golf hatchback. However, in recent years, the Tiguan and Polo have surpassed the Golf in global sales. Volkswagen’s new electric ID range is expected to surpass these cars in the years to come.
In 2025 to date, Volkswagen has sold 107,608 new cars in the UK, securing a 9.1% market share. This compares with 97,598 over the same period in 2024.
BMW Car Sales Statistics
- So far in 2025, BMW has sold 73,787 new cars in the UK, giving it a 6.25% share of the market. This is down from 79,712 over the same period in 2024.
- In 2024 BMW sold 2.2 million vehicles globally, a decrease of 2.3% on 2023.
- BMW sold a record-breaking 2,253,835 vehicles in 2023, marking its best year ever, with deliveries rising by 7.3% compared to 2022.
- In 2023, BMW set a new annual record sales of 362,244 vehicles in the U.S.
- In 2024, the BMW group delivered 593,215 electric vehicles worldwide,up from 566,486 in 2023.
- BMW sold 330,596 cars without a combustion engine in 2023 - this represents a massive jump of 92.2% compared to 2022.
- MINI sold 295,474 vehicles globally in 2023, but 2024 sales dropped 17.1% with 244,915 sales.
- Asia was BMW’s biggest market, with 1,070,142 vehicles sold in 2023, and this continued in 2024 - China alone accounted for 824,932 sales.
- In 2023, BMW recorded 942,805 vehicle sales in Europe, a 7.5% YoY increase from 2022.
Chevrolet Car Sales Statistics
- In 2024, General Motors (which includes Chevrolet, GMC, Cadillac and Buick) sold approximately 2.705 million vehicles.
- In 2023, Chevrolet sold 1,702,700 vehicles in the U.S. - the company’s highest-ever sales year was 2005 with 2,584,509 vehicles sold.
- Chevrolet grew its sales in Canada by 18.4% in 2023. The automaker sold 135,484 vehicles in the Canadian market in 2023 Vs. 114,435 sold in 2022.
- Brazil registered 327,781 Chevrolet vehicles in 2023 - Mexico (172,066), Colombia (23,241), Argentina (30,437), and Chile (18,861).
Tesla Car Sales Statistics
In 2023, Tesla sold 654,888 vehicles in the US alone. The Model Y was the most popular Tesla EV (394,497 sold) followed by the Model 3 (220,910 sold). Tesla Model X and Model S sold 23,015 and 16,466 units respectively.
- Tesla's US sales have stalled in 2025 relative to the company's usual performance. July marked the 6th consecutive month Tesla registrations fell, despite overall EV registrations increasing.
- Up until this point in 2025, Tesla has sold 23,708 new cars in the UK, representing a 2.01% market share. This is lower than the 25,491 recorded over the same period in 2024.
- Tesla sold 603,304 EVs in China in 2023. The automaker faced stiff opposition from China’s BYD which sold 1,262,065 BEVs.
Global car sales by brand
Total number of global vehicle sales by manufacturer in 2022
Manufacturer
- Toyota
- Volkswagen Group
- Hyundai/Kia
- Stellantis
- General Motors
- Ford
- Honda
- Nissan
- BMW
- Changan
Sales
- 9.56 million
- 8.26 million
- 6.84 million
- 6.0 million
- 5.94 million
- 4.23 million
- 4.07 million
- 3.22 million
- 2.39 million
- 2.34 million
Until recently, an average of over 2 million new cars were sold each year in the UK (using data since 2001). However, in 2020 and the height of the pandemic, car sales slumped and numbers have been recovering since - in 2024, over 1.95 million new cars were sold.
At the end of 2024 there were 33.97 million cars in the UK, making up 81.5% of all licensed vehicles.
In 2024 7,643,180 used car transactions took place, a 5.5% increase on 2023. This represents the highest annual total on record, marking an eighth consecutive quarter of growth in the used car market.
In 2023, there were 7,242,692 used car sales in the UK - a 5.1% increase from the previous year’s 6,890,777 used vehicle transactions. Out of these, only 1.6% (118,973 cars) were battery electric vehicles.
Thanks to rising consumer demand and enhanced accessibility of electric models, the UK is witnessing rapid growth in the number of registered electric cars. As of 2025, the number of fully electric cars on UK roads was over 1.3 million units, with an additional 620,000 as plug-in hybrids.
In 2024 Volkswagen remained as the most popular car brand in the UK, with 8.5% of the market share. Volkswagen sold 166,304 new cars, followed by BMW who sold 125,265.
The Ford Puma was the UK's most popular car in 2024, with 48,340 sales, followed by the Kia Sportage with 47,163 sales and the Nissan Qashqai with 42,418.
The Ford Puma is the UK's most popular SUV, with more than 48,000 sales in 2024.
SMMT, The Department for Transport, Bloomberg, NEF, national statistical agencies, CarExpert, JATO, Forbes, GM Authority, Nikkei Asia, US Department of Energy, Car And Driver, Dongchedi, JADA, Best-Selling-Cars, IndiaToday, Kelley Blue Book, EV Volumes, CNBC, GoCompare, Porch Group Media, Beepi, Miami Herald, SwansWay Garages, ING, ACEA, Factory Warranty List, GoodCarBadCar, WhatCar, China Auto Dealers Association, AAA-Data, KBA, Facon Auto, Scotia Bank, Stat Canada, SIMI, Trading Economics, LTA, BMW Group, Tesla, CAAM, Porch Group Media, Beepi, F&I Tools, BBC, Electric Vehicle Council, SIAM, RACV, Go Auto, NZ Transport Agency, Statistics Canada, Car Expert, SIMI,
Find your perfect used car
Whether you're looking for an automatic car, an SUV or even a campervan, we've got the used car for you